Complete Core Web Vitals Guide for High Performance
Master Core Web Vitals optimization to improve real-world page speed and SEO ranking.

Core Web Vitals are a set of standard Google performance metrics that measure real user experience based on three main aspects: page load speed through Largest Contentful Paint (LCP), interaction responsiveness via Interaction to Next Paint (INP), and visual layout stability using Cumulative Layout Shift (CLS). These three act as key ranking signals and determine overall user satisfaction.
Many web developers still get stuck chasing a perfect 100 score in Lighthouse. They assume green numbers on an automated test screen guarantee a safe spot in search engines.
In reality, a webpage that scores perfectly on a developer's laptop often fails in Google Search Console. Real-world visitors access the web using low-end phones with unstable mobile signals, not fiber-optic connections and fast processors. To close this gap, you need to understand how these field metrics work and apply fixes directly at the code level.
Why Core Web Vitals Are the Standard for User Experience
Technically, Core Web Vitals are quantitative indicators that judge whether a webpage feels fast, responsive, and stable to humans. Google does not rate your site purely on how fast a server responds in a testing lab, but rather on telemetry data from millions of Chrome browser users collected in the Chrome User Experience Report (CrUX).
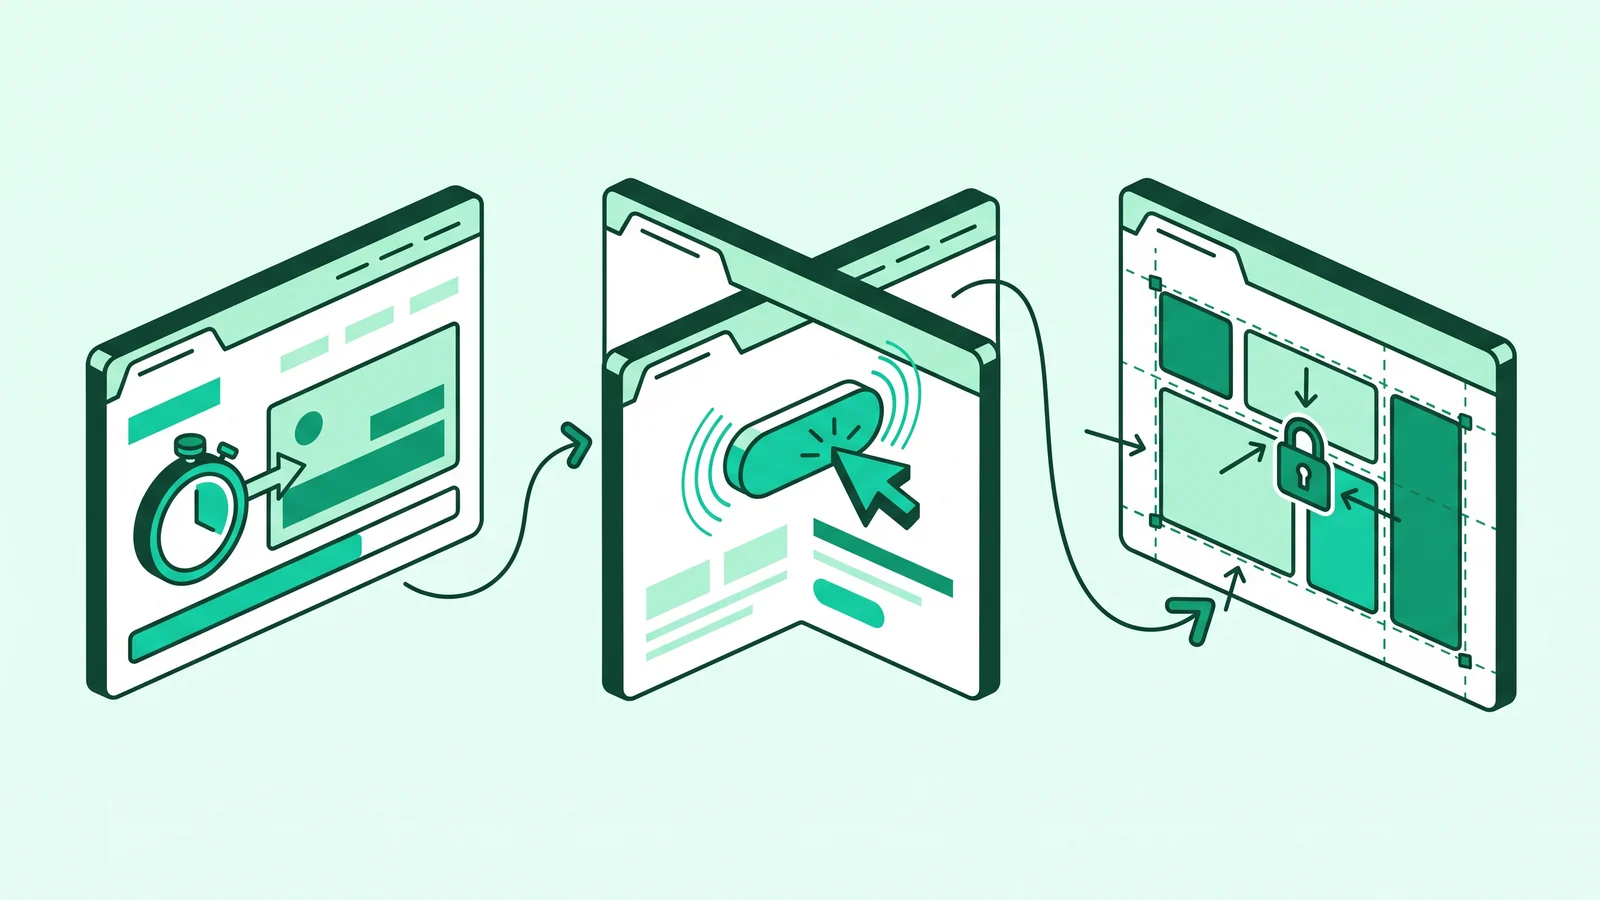
Adam Clarke explains in his book SEO 2025 that these metrics shift a site owner's focus from just stuffing keywords to improving technical quality that visitors actually feel. When a page responds slowly to a tap or a button suddenly moves just as someone tries to click it, users will immediately close the browser tab.
Since March 2024, Google officially retired First Input Delay (FID) and replaced it with Interaction to Next Paint (INP). This change closes a major gap in how developers measure interactivity. FID only recorded the delay of the very first click, while INP tracks the latency of all user interactions throughout their entire session on the page.
1. Largest Contentful Paint (LCP)
LCP calculates the time it takes a browser to render the largest visual element in the initial viewport once a user requests a URL. This element is usually a hero image, a video poster, or a large block of text.
If the server responds slowly or CSS and JavaScript downloads block the main image, the LCP time will spike. Visitors will just stare at a blank white screen for much longer.
2. Interaction to Next Paint (INP)
INP measures the time from when a user interacts (clicking a menu, tapping an add to cart button, or typing in a search bar) until the browser successfully draws the visual update on the next frame. Web Almanac data shows that around 35% to 43% of websites still fail to meet the safe INP threshold on mobile devices.
The main culprit is heavy JavaScript execution that locks up the browser's main thread. When a phone processor is busy running tracking scripts or hydrating interface components, the screen freezes momentarily and ignores user taps.
3. Cumulative Layout Shift (CLS)
CLS measures how often and how far visual elements shift unexpectedly while a page loads. Dario Benevento highlights in his book Frontend Development that layout shifts severely damage the user experience. Imagine a visitor intending to press a "Cancel" button, but an ad banner suddenly loads and pushes the page down, causing their finger to hit "Buy Now" instead.
Core Web Vitals Assessment Pass Rules and Data Disparity
When you open PageSpeed Insights, the very top section shows your Core Web Vitals Assessment status labeled as Passed or Failed. Google's rules here are strict: your page or site only passes if all three core metrics (LCP, INP, and CLS) land in the green zone (Good) at the 75th percentile (p75).
The 75th percentile means that at least 75% of all visits to your page over the last 28 days must experience performance below the maximum threshold. If your LCP and CLS are very fast, but your INP hits 250 milliseconds (Needs Improvement), the overall assessment status still fails.
Do not confuse the Lighthouse performance score (0 to 100) with the Core Web Vitals Assessment result. The Lighthouse score at the bottom of PageSpeed Insights is Lab Data tested once without any user interaction. Official passes in Google Search Console rely entirely on Field Data (CrUX) from real visitor devices collected over the past 28 days.
Many developers get confused when they see a 98 Lighthouse score on their local computer, yet their Search Console report shows thousands of URLs labeled Poor. This happens because the Lighthouse bot never scrolls down the page, never opens dropdown menus, and never clicks product filters. In the real world, when users perform these actions on lower to mid range phones, heavy JavaScript triggers INP spikes and CLS shifts that only CrUX captures.
Practical Guide to Checking and Auditing Issues
Before you change any code, you need to accurately map out where the performance bottlenecks are. A complete Core Web Vitals check requires combining field data with lab simulations.
Identify URL Clusters in Google Search Console
Open the Google Search Console dashboard, then go to the Core Web Vitals menu. Check the Mobile tab first since Google uses mobile first indexing. Look for URL groups marked in red (Poor) or yellow (Needs Improvement) to find out which page templates cause the most trouble.
Run Tests in PageSpeed Insights
Copy a URL from the problematic group, then test it through PageSpeed Insights. Compare the Discover what your real users are experiencing section (field data) with the Diagnose performance issues section (lab data) to see correlations in what slows the page down.
Track Long Animation Frames in Chrome DevTools
Open the page in the Chrome browser, right click and select Inspect, then open the Performance tab. Set the CPU throttling option to 4x slowdown to simulate a mobile processor, then record activity while clicking various buttons on the page. Look for red blocks labeled Long Task or use the Long Animation Frames (LoAF) API available since Chrome 123 to see specific script URLs and functions holding up rendering for more than 50 milliseconds.
Monitor Live with the Web Vitals Extension
Install the official Web Vitals extension from the Chrome Web Store. Enable console logging in its settings, then interact with your web interface elements to watch the LCP, INP, and CLS numbers change in real time every time you press a button.
LCP Optimization Strategy: Cutting Load Time Below 2.5 Seconds
To fix LCP, focus your attention on two things: how fast the HTML document arrives at the browser (Time to First Byte or TTFB), and how quickly the browser finds and downloads the largest visual asset.
The most fatal mistake often seen in web projects is applying the loading="lazy" attribute universally to all images. When a hero banner image at the very top of the page gets lazy loaded, the browser delays downloading that image until it calculates the entire layout. As a result, the LCP time shoots right past 4 seconds.
Turn off lazy loading for the main image above the fold, then provide the highest download priority instruction using the fetchpriority="high" attribute:

If your project is built on the Vue ecosystem, you can learn more about image component configuration and meta optimization in the guide to High Performance Nuxt Content and Technical SEO.
Beyond optimizing images, push down your server's TTFB number. If your site uses Server Side Rendering (SSR), apply edge caching strategies so the HTML document serves directly from the CDN server closest to the user's location. You can read the technical implementation in Mastering Cloudflare Workers for Modern Serverless Edge to cut server response waiting times to under 50 milliseconds.
INP Optimization Strategy: Overcoming Hydration Tax and Long Tasks
Optimizing Core Web Vitals for INP is the biggest challenge for modern frontend developers. Frameworks like Nuxt, Next, or React make it easy to build interactive interfaces, but they carry a hidden burden called the hydration tax.
When an SSR page appears on a user's screen, it is initially just static HTML. The browser then has to download the JavaScript bundles and run the hydration process to attach event listeners to all DOM nodes. On low end phones, this process often locks the main thread for 500 to 1,500 milliseconds. If a user taps a menu button exactly while hydration takes place, the interface will not respond, and the INP score instantly drops.
Breaking Down Heavy Tasks with scheduler.yield()
When a JavaScript function must process large amounts of data after a user presses a button (like filtering hundreds of products while updating button styles), do not bundle it all into one synchronous execution. Break the task apart so the browser has a chance to draw visual changes on the screen first.
Avoid the old trick of using setTimeout(..., 0) because that method throws the remaining work to the very back of the browser's task queue. Use the modern web standard API scheduler.yield(), which returns control to the browser to render a frame, then immediately resumes the rest of your function with high priority:

Reducing Hydration Load and Third Party Scripts
For Vue based applications discussed in the article Introduction to Nuxt JS: Modern Vue SSR & SSG Framework, take advantage of lazy hydration features or Server Only components (.server.vue) for parts of the page that do not need client side interactivity. Do not let components below the fold burden the processor right when the page opens.
Move third party scripts like Google Tag Manager, Meta Pixel, or customer chat widgets away from the main thread. You can run these analytics scripts inside a Web Worker using a library like Partytown, allowing data tracking activities to run in the background without disrupting the main interface's responsiveness.
CLS Optimization Strategy: Locking Layouts Early
Fixing CLS is actually the easiest from a technical standpoint, but it requires discipline in writing CSS and HTML. The main principle is simple: never let the browser guess element sizes before their assets finish downloading.
Set Explicit Dimensions and Aspect Ratios
Always write width and height attributes on every image, video, and iframe tag. In modern browsers, these two attributes work together with CSS to calculate the aspect ratio automatically and provide a perfectly sized empty box before the image file finishes loading.
For dynamic components like ad slots, review widgets, or skeleton screens, lock their sizes using the CSS aspect-ratio and min-height properties:

Handling Layout Shifts from Web Fonts
Subtle layout shifts that often ruin CLS scores come from loading custom web fonts. When the browser displays text using a system font first (fallback font), then swaps it for a custom font that has a different line height and character width (Flash of Unstyled Text), entire paragraphs on the page get pushed down.
Resolve this issue by matching the fallback font dimension metrics using font descriptor override properties in your CSS:
By aligning the size-adjust and ascent-override proportions on the local font, switching to the custom font will barely change the paragraph height, keeping your CLS value at 0.
Once you push all LCP, INP, and CLS fixes to your production server, immediately open Google Search Console and press the Validate Fix button on the problematic reports. Be patient and do not change your architecture repeatedly in the short term, as Google needs up to a full 28 days to update your passing status based on the new real user data cycle.
Frequently Asked Questions (FAQ)
First Input Delay (FID) only measures input delay on the very first interaction when a page loads and does not calculate event handler processing duration. Interaction to Next Paint (INP), which replaced FID in March 2024, measures the total latency of all clicks, taps, and keyboard interactions the entire time a user is on the page until visual changes actually appear on the screen.
This status appears because your site or URL group does not yet have enough Chrome browser user traffic volume to meet the minimum privacy and statistical thresholds in the CrUX database. While traffic stays low, use lab data from Lighthouse and Chrome DevTools as your reference for fixes.
Status changes in Google Search Console and PageSpeed Insights field data take up to 28 days. The CrUX dataset calculates average performance at the 75th percentile using a rolling aggregation window over the last 28 days.
Not automatically. These metrics are part of the Page Experience signal. Content relevance and information authority remain the primary deciders, but when two sites have equal content quality, the site that passes this performance test gets priority in search results.